How to Measure SEO Using Google Analytics
Understanding how to measure digital marketing effectiveness can make a big difference when it comes to deciding what steps to take and act on with your SEO and Digital Marketing efforts. There are lots of ways to measure how well you are doing in achieving your goals. And speaking of goals, the first step is determining what your goals are, and then set the measuring tools in place.
Setting Goals
Setting goals is an important first step in measuring digital marketing effectiveness. The old saying “if you don’t know where you’re going, every road will lead you there” is a good baseline to start with when considering how you want to measure goals. Questions to ask: What will be your measure of success? Rank on page 1 of Google search? Increased website visits? More engagement with your web content?
The list can be endless. This is why you need to set specific goals you want to measure before moving too far down the digital marketing path. You can build on those goals as you move on. But start with a few key measurable goals.
One of the first steps I take with new clients is setting realistic and achievable goals. What actions and results do we want to measure? How will those goals get reported (daily, weekly, monthly)? What measurement tools do we have, and what will we need?
Here are 5 common goals I measure with clients in digital marketing and SEO campaigns.
Goal 1: Increase Website Traffic
Increased visitors to your website can be measured in Google Analytics. This data appears in the Source/Medium report in the Acquisitions tab of Google Analytics (#1 in the screenshot below). In this report, the Source is the origin of the traffic, such as a search engine. Medium is the general category of the source, such as Organic traffic. (#2 in the screenshot below).
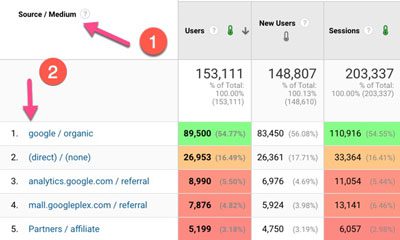
You measure increased website traffic in 3 basic ways — by Users, New Users, and Sessions.
- Users — the total number of visitors to your website during the time specified — in aggregate. This number includes multiple visits by one user.
- New Users — individuals who visited your site during the time specified. This number reflects unique visits and doesn’t count multiple visits.
- Sessions — a group of interactions one user takes within a given time frame on your website, typically 30 minutes by default.
Setting a goal over time to increase your website traffic by a percentage, such as “20% growth in New Users each month for the next 3 months” is a great way to measure the effectiveness of your website in reaching new users.
Goal 2: Lower Bounce Rate
Bounce Rate in Google Analytics is the rate at which users leave your website without visiting any other page other than the one they landed on. Typically, this initial landing page is the home page.
If you see a high bounce rate based on home page visits, that is an indication that the content on that page is not incentivizing users to click through to another page.
Bounce Rate is essentially a key measure of Engagement, one of the high ranking factors in SEM (Search Engine Marketing) that reflects how robust your website is.
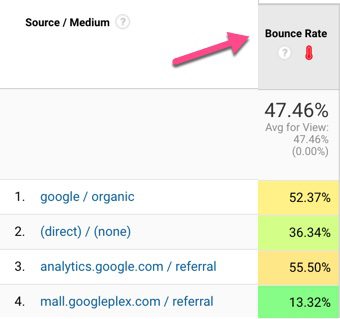
Let’s say that your goal is to lower the Bounce rate average from 47% to 35% over the next month.
One strategy for lowering the Bounce Rate could included adding more internal links to your web pages. Internal links are links that link to relevant internal pages on your site.
By linking to a blog post or other page related to the content the user is reading, you can encourage greater interaction with the content, and in doing so begin to see Bounce Rates decline over time.
Goal 3: Keyword and Keyword Phrase Discovery
Desirable keywords and keyword phrases are ones that match up with how your target audience is search for information. These keywords and keyword phrases are found via keyword research tools.
I use tools such as SEMRush, Moz, and Ahrefs to find high ranking pages centered around a topic you want to rank high for. By discovering pages already ranking high for those keywords and keyword phrases, keyword research is used to find alternative versions of those words or phrases that may be less competitive, offering the opportunity to rank higher for those keywords in less time due to less competition for the keywords.
Generally, I will build a robust list of related keywords, ranking highest to lowest by Volume. See a sample list of related keywords below for the query “pet leash.”
See the image below for a list of highly relevant keywords associated with “pet leash.” The keywords highlighted all show a high degree of Relevancy (ie they are closely associated with “pet leash”) as well as a significant level of monthly search (Monthly Volume).
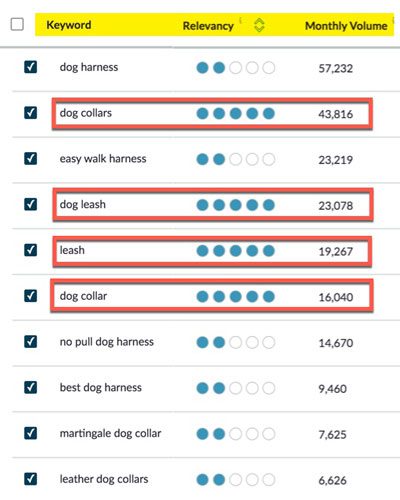
The next step would be to incorporate these keywords into an existing page about pet leashes, or better yet, add a new page on the topic using several of the new keywords as a focus for that page. And then, link to the new relevant page from the previous page on Pet Leashes.
This is how you use keyword are keyword phrase research to increase your rankings in Google organic search results.
Goal 4: Build Behavior Flow Maps
Understanding how users engage with your website content is a key factor in making your website more robust. Website behavior patters can be monitored in Google Analytics. Once you have an understanding of how users are engaging with your content, you can begin improving page design and keyword structure to help influence behavioral goals.
For example, in the Google Analytics Behavior Map chart below, we can see that, during the selected time period, the majority of users visiting the home page (indicated by a “/” on the chart), totaling 24k users, visited one of 5 pages on the site.
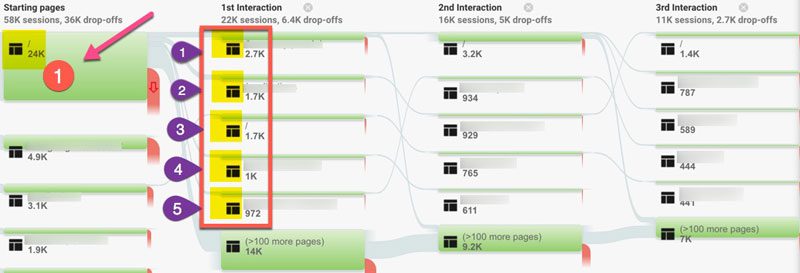
2.7k of those users visited the first page shown. This means they clicked on a link on the home page to go to that page. The Analytics data shows that 1.1k of those 2.7k exited the site from that page, meaning the site lost the opportunity to have the users engage further with the content.
This high drop-off rate is good information. It tells us that the page needs to work harder to keep users engaged. This could be done in the form of supplementary content (video, audio) on the page, or additional copy that supplements the copy on the page.
From there, 456 users went to the top-performing page in this behavior flow analytics visual. Note a significant problem here: the page these users went to is back to the home page (“/”).
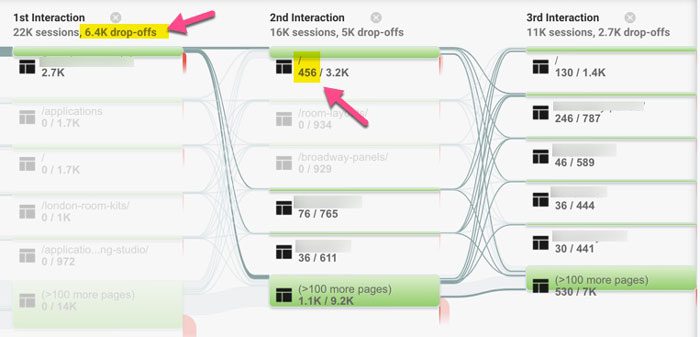
This is a good indication that they did not get the information expected or wanted, so they went back to the home page to try again.
So, behavior flow analysis is an excellent measure of digital marketing activity on your website, as well as an insight into how to improve your website’s performance and results.
Goal 5: Increased Time On-Site
A fifth metric used to measure digital marketing effectiveness is time on site. This is a reflection of how engaged users are to your website, based on the amount of time they spend on Pages per Session, as well as the Average Session Duration.
See the screenshot below reflecting both values.
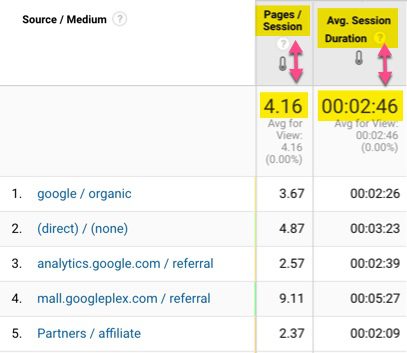
In the screenshot, you can see that the average number of user Pages per Session during the time period analyzed was just over 4 pages. And the Average Session Duration was 2:46, for an average on-page time during each session of about 40 seconds per session.
With this data in mind, you would want to determine if your goal was to increase per-page session time, say up to 1.5 minutes per session. Based on this goal, and using the existing data as a reference, this would indicate that possibly a video or audio clip on a couple of the pages would keep users engaged longer, helping you achieve the goal of increase on-page time.
Goal 5.1 — Measuring Social Media
Measuring Social Media engagement is also an important component of digital marketing metrics. While Google Analytics will help you understand how users are interacting with content on your website, tools like Facebook Analytics will help you see how engaging your posts are —engagement being defined as things like Likes, Comments, Shares, etc.
